Revenue Intelligence
Market rent benchmarking, occupancy scenario modeling, and concession tracking — so you price every unit on current market data, not last quarter's gut feel.
Explore RevenueRentnoi gives mid-size multifamily operators a single analytics layer across revenue, expenses, and leasing — without replacing Yardi or AppFolio.
Connects to your existing property management software
Property managers track revenue, expenses, and leasing in separate systems. By the time the data is consolidated, the opportunity to act has passed. Rentnoi connects the dots in real time.
Each module maps directly to the NOI formula: maximize revenue, control expenses, optimize leasing velocity.
Market rent benchmarking, occupancy scenario modeling, and concession tracking — so you price every unit on current market data, not last quarter's gut feel.
Explore RevenueVendor spend analysis, maintenance cost benchmarking, and utilities normalization across your portfolio — identify the line items dragging down NOI before month-end.
Explore ExpensesExpiration forecasting, renewal probability scoring, and leasing velocity trends — so your team acts on renewals before the 60-day window closes.
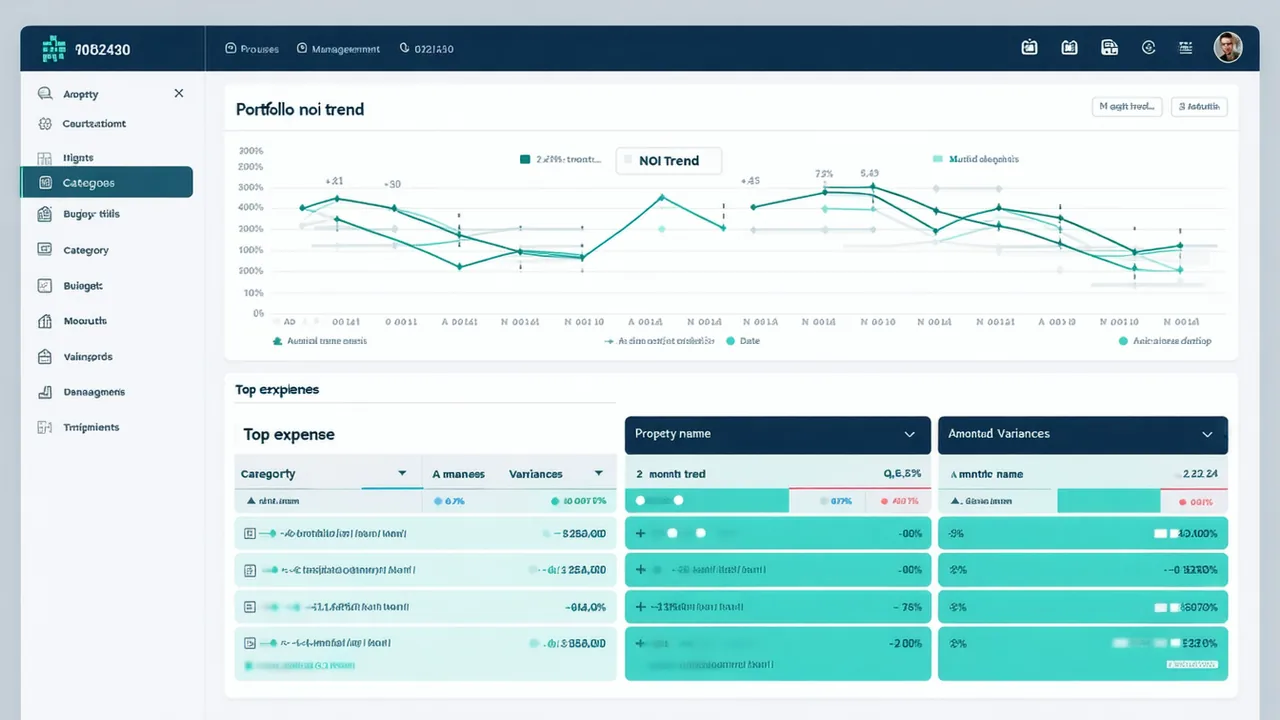
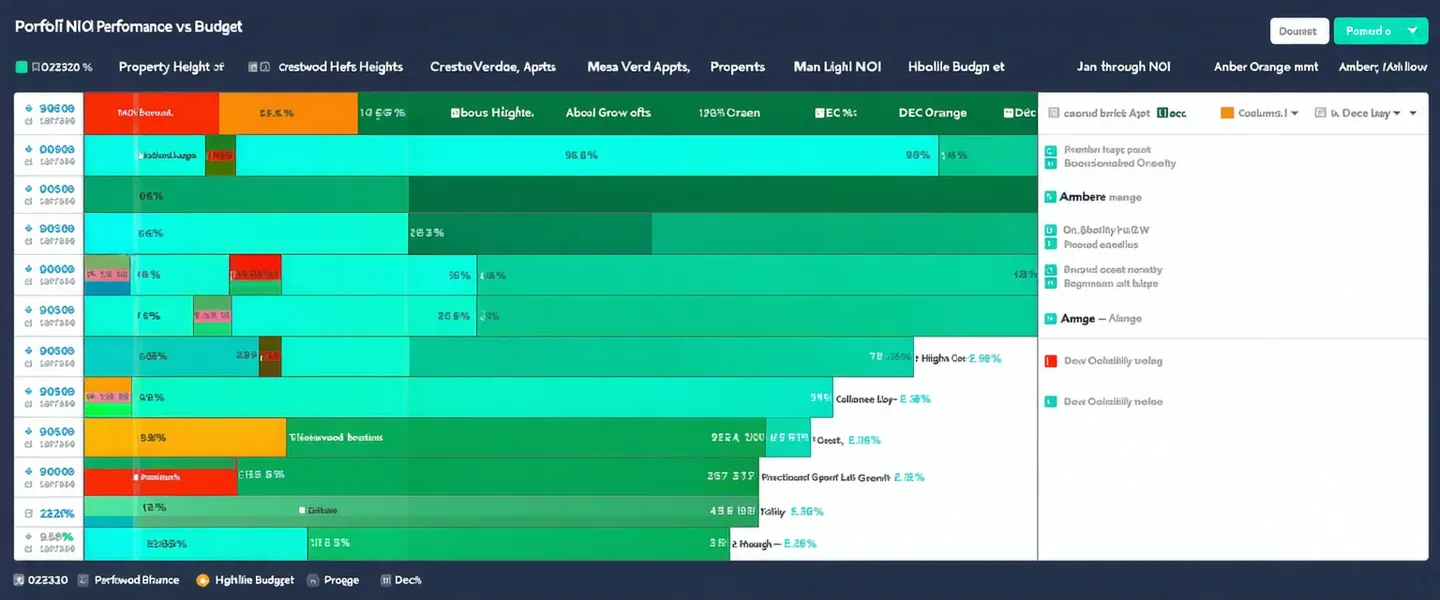
Explore LeasingThe Rentnoi portfolio view aggregates NOI performance across all your properties in one dashboard. Drill down from portfolio to property to unit in three clicks.
Rentnoi reads data directly from Yardi, AppFolio, Buildium, or your current system via secure API. No data migration. No re-entry.
Within 48 hours of connection, your portfolio's NOI baseline is mapped — with variance breakdown by property, unit type, expense category, and lease cohort.
Rentnoi surfaces the top 5 actions with the highest NOI impact — ranked by property, so your team knows exactly where to focus this week.
We had the data in three different systems. Rentnoi was the first tool that let us see the whole picture without a full-day reconciliation.
The expense variance dashboard flagged a vendor overrun we'd been missing for six months. Caught it in week two.
Rentnoi is an analytics layer — not a replacement for your property management system. It reads from Yardi, AppFolio, Buildium, RealPage, Entrata, and MRI.
View All IntegrationsRentnoi connects in days. Your team is looking at real data within 48 hours of setup.