Expense Optimization
See every dollar leaving your portfolio
NOI = Revenue − Expenses. Both sides matter. Rentnoi tracks vendor spend, maintenance costs, and utilities across all your properties — and surfaces the line items dragging down NOI before month-end close.
The problem
Expense overruns compound silently across properties
Vendor invoices come in piecemeal. Maintenance costs vary by season and by property manager. Utilities spike without explanation. By the time you reconcile the GL at month-end, the overrun has been there for weeks.
Rentnoi pulls your GL data from your PMS and maps expenses against budgets by category and property in real time — so overruns are visible the week they happen, not the month after.
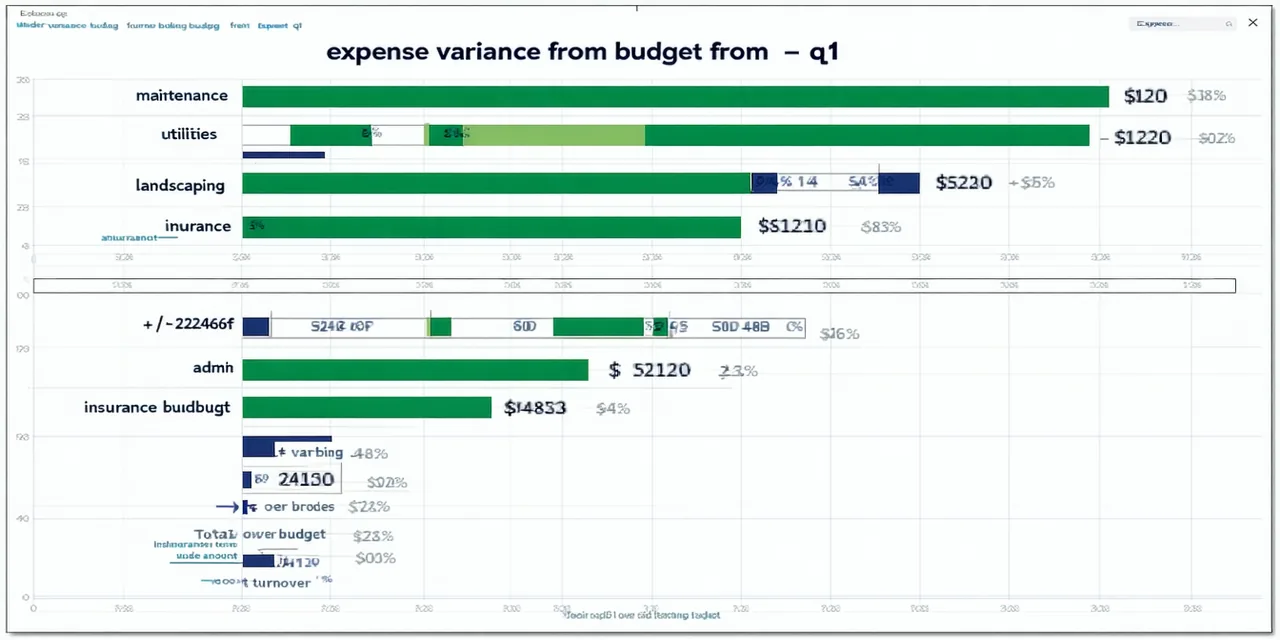
Expense Variance — Month to Date
Maintenance
+18%
Utilities
+12%
Admin
-7%
Landscaping
-4%
Insurance
+9%
Features
What Expense Optimization tracks
- Vendor spend analysis and cross-property benchmarking — see if one property is overpaying the same contractor
- Maintenance cost per unit tracking with seasonal normalization — filter out weather-driven spikes from true overruns
- Utilities normalization (weather-adjusted) — so January heating costs are compared to January baselines, not July averages
- CAM reconciliation support — track recoverable vs. non-recoverable expense splits across your portfolio
- Expense budget vs. actual variance by category — flagged automatically when variance exceeds your threshold
Map your expense baseline — connect in days
Connect your PMS and see your expense variance dashboard within 48 hours.